Canadian Immigrants in the United States

Flags of the United States and Canada. (Photo: Ashley Fraser/U.S. Embassy and Consulates in Canada)
Historically close cultural and economic ties have prompted Canadians to move to the United States for generations. Significant numbers of Canadian immigrants come for work or relaxation, with many retirees residing for at least part of the year in Sun Belt states.
Migration from Canada was relatively unrestricted through the 19th century and the first half of the 20th century. The first recorded immigrant to become a U.S. citizen under the modern system was a Canadian, Lyman Ferris, who came for better economic opportunities and naturalized in 1907. By 1960, about one in ten U.S. immigrants was Canadian. While the absolute number of Canadian immigrants has remained largely flat over time, their share of the U.S. foreign-born population has declined significantly, as U.S. immigration increased from other regions and socioeconomic and educational conditions in Canada reduced emigration pressures.
Approximately 828,000 Canadian-born immigrants lived in the United States as of 2023, comprising less than 2 percent of all 47.8 million U.S. immigrants, although in parts of Florida, Arizona, and northern border states, Canadians represent significant shares of the immigrant population. Meanwhile, as many as 1 million U.S. immigrants and Canadian-born children of U.S. citizens were estimated to be living in Canada. Many Indigenous people can also move freely between the two countries.
Compared to the overall U.S. foreign-born population, immigrants from Canada tend to be older, have lived in the United States for longer, and are more likely to have come through employment pathways. On average, they are also highly educated and have high incomes. While typically proficient in English, one-fifth of Canadian immigrants report speaking another language at home, usually French, reflecting the bilingual skills of the Quebecois and other French-Canadian people.
Amid new tensions over the Trump administration’s imposition of steep tariffs and repeated comments about annexing Canada, many Canadians canceled short-term travel to the United States. Whether these tensions reorder immigration and longer-term relations between two historically friendly neighbors that share the world’s longest border (5,525 miles) remains to be seen.
This Spotlight provides information on the Canadian immigrant population in the United States, focusing on its size, geographic distribution, and socioeconomic characteristics.
Click on the bullet points below for more information:
- Size of Immigrant Population over Time
- Distribution by State and Key Cities
- English Proficiency
- Age, Education, and Employment
- Income and Poverty
- Immigration Pathways and Naturalization
- Health Coverage
- Diaspora
- Top Global Destinations
- Remittances
Size of Immigrant Population over Time
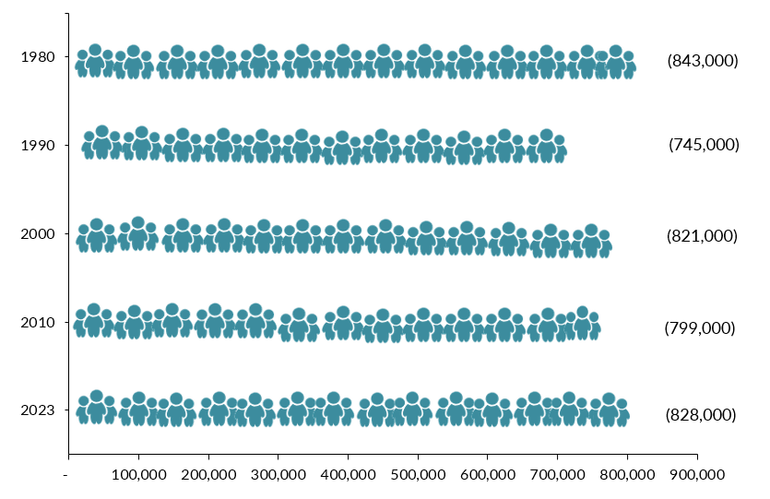
The number of Canadian immigrants in the United States has remained relatively stable over the last four decades. In 1980, there were 843,000 Canadian immigrants in the United States; the population hit a low of 754,000 in 1990 but since rebounded (see Figure 1). From 2010 to 2023, the number of Canadian immigrants grew by 4 percent, even as the overall U.S. immigrant population expanded by 20 percent.
Figure 1. Canadian Immigrant Population in the United States, 1980-2023

Source: Data from U.S. Census Bureau’s 2010 and 2023 American Community Surveys (ACS), and Campbell J. Gibson and Kay Jung, “Historical Census Statistics on the Foreign-Born Population of the United States: 1850-2000” (Working Paper no. 81, U.S. Census Bureau, Washington, DC, February 2006), available online.
Distribution by State and Key Cities
Canadians are sparsely distributed throughout the United States, though with a preference for Sunbelt states. The highest concentrations of Canadian immigrants as of the 2019-23 period were in California (16 percent) and Florida (13 percent). The states with the next largest populations were New York and Texas (7 percent apiece), followed by Washington (6 percent) and Arizona (5 percent). Fifty-three percent of Canadian immigrants resided in one of these six states. Meanwhile, Canadians accounted for about 19 percent of immigrants in Maine and 18 percent of those in Vermont
Their top counties of residence—Los Angeles County, California; Maricopa County, Arizona; King County, Washington; Broward County, Florida; and Orange County, California—were home to 13 percent of all Canadian immigrants in the United States.
Click here for an interactive map that highlights the states and counties with the highest concentrations of immigrants from Canada or another country.
As of the 2019-23 period, the greater New York, Los Angeles, Miami, and Phoenix areas were home to 19 percent of Canadian immigrants in the country (see Figure 2).
Figure 2. Top Metropolitan Destinations for Canadian Immigrants in the United States, 2019-23

Note: Pooled 2019-23 ACS data were used to get statistically valid estimates at the metropolitan statistical-area level for smaller-population geographies. Not shown are the populations in Alaska or Hawaii, which are small in size. For details, visit the Migration Policy Institute’s (MPI) Migration Data Hub for an interactive map showing geographic distribution of immigrants by metro area, available online.
Source: MPI tabulation of data from U.S. Census Bureau pooled 2019-23 ACS.
Click here for an interactive map that highlights the metro areas with the most immigrants from Canada or another country.
Canadian immigrants’ level of proficiency in English is comparable to that of the U.S. born and much higher than that of the overall foreign-born population. In 2023, just 4 percent of Canadian immigrants ages 5 and older reported speaking English less than “very well,” compared to 47 percent of all immigrants.
Approximately 80 percent of Canadian immigrants spoke only English at home, versus 17 percent of all immigrants.
Age, Education, and Employment
Canadian immigrants are on average older than the overall foreign- and U.S.-born populations. Their median age in 2023 was about 55, compared to 47 for all immigrants and 37 for the U.S. born. Canadian immigrants were more likely than the native born, but less likely than immigrants overall, to be of working age (18 to 64 years old; see Figure 3).
Figure 3. Age Distribution of the U.S. Population, by Origin, 2023

Note: Percentages may not add up to 100 as they are rounded to the nearest whole number.
Source: MPI tabulation of data from the U.S. Census Bureau’s 2023 ACS.
Canadians have higher rates of educational attainment than both the native- and overall foreign-born populations. In 2023, approximately 53 percent of Canadian immigrants ages 25 and older reported having a bachelor’s degree or higher, compared to 36 percent of U.S.-born and 35 percent of immigrant adults (see Figure 4).
Figure 4. Educational Attainment of the U.S. Population (ages 25 and older), by Origin, 2023

Note: Percentages may not add up to 100 as they are rounded to the nearest whole number.
Source: MPI tabulation of data from the U.S. Census Bureau 2023 ACS.
Click here for data on immigrants’ educational attainment by country of origin and overall.
Of all 1.1 million international students enrolled in U.S. higher education institutions in the 2023-24 school year, about 29,000 (3 percent) were from Canada, according to the Institute of International Education. While India (29 percent) and China (25 percent) were by far the largest origin countries of international students, Canada ranked fourth, just behind South Korea (4 percent).
Canadians participate in the U.S. civilian labor force at lower rates than the native- and overall foreign-born populations, a trend consistent with their older median age. About 58 percent of Canadian immigrants ages 16 and older were in the civilian labor force in 2023, compared to 63 percent and 67 percent of U.S.- and the foreign-born populations, respectively. Of those Canadian immigrants who were employed, nearly seven out of ten were in management, business, science, and arts occupations, a far greater share than foreign-born workers overall or those born in the United States (see Figure 5).
Figure 5. Employed Workers in the Civilian Labor Force (ages 16 and older), by Occupation and Origin, 2023

Note: Percentages may not add up to 100 as they are rounded to the nearest whole number.
Source: MPI tabulation of data from the U.S. Census Bureau’s 2023 ACS.
Canadian immigrants tend to have significantly higher incomes than the overall foreign- and native-born populations. Households headed by a Canadian immigrant had a median annual income of $104,300 in 2023, compared to $78,700 for all immigrant-led households led and $77,600 for native-born households.
In 2023, 9 percent of Canadian immigrants were living in poverty, which was a lower share than for the U.S. born (12 percent) and immigrants overall (14 percent). (The U.S. Census Bureau defines poverty as having an income below $30,900 for a family of four in 2023).
Immigration Pathways and Naturalization
Canadians are roughly as likely as immigrants overall to be naturalized U.S. citizens. In 2023, 51 percent of Canadian immigrants were U.S. citizens, compared to 52 percent of the total foreign-born population.
More than half of Canadians have lived in the United States since at least the 1990s: 54 percent arrived before 2000, compared to 44 percent of the overall immigrant population (see Figure 6).
Figure 6. Canadians and All Immigrants in the United States, by Period of Arrival, 2023

Note: Percentages may not add up to 100 as they are rounded to the nearest whole number.
Source: MPI tabulation of data from the U.S. Census Bureau’s 2023 ACS.
In fiscal year (FY) 2023, approximately 11,900 Canadians became lawful permanent residents (LPRs, also known as green-card holders), accounting for 1 percent of all 1.2 million new green-card recipients. The most common pathway for Canadians to receive a green card is through family; in FY 2023, 46 percent were sponsored by an immediate U.S.-citizen relative and another 6 percent through family-based preferences (see Figure 7). Compared to other green-card recipients, Canadians were much more likely to come through employment channels: 45 percent compared to 17 percent of all LPRs.
Figure 7. Immigration Pathways of Canadian and All New Lawful Permanent Residents in the United States, FY 2023

Notes: Immediate Relatives of U.S. Citizens: Includes spouses, minor children, and parents of U.S. citizens. Family-Sponsored Preferences: Includes adult children and siblings of U.S. citizens as well as spouses and children of green-card holders. The Diversity Visa lottery was established by the Immigration Act of 1990 to allow entry to immigrants from countries with low rates of immigration to the United States. The law states that 55,000 diversity visas in total are made available each fiscal year. Individuals born in Canada were not eligible for the 2026 lottery. Percentages may not add up to 100 as they are rounded to the nearest whole number.
Source: MPI tabulation of data from U.S. Department of Homeland Security (DHS), Office of Homeland Security Statistics (OHSS), “Table 10: Persons Obtaining Lawful Permanent Resident Status by Broad Class of Admission and Region and Country of Birth: Fiscal Year 2023,” updated September 16, 2024, available online.
Canadian immigrants are very likely to have health insurance. The share that was uninsured in 2023 was similar to that of the U.S. born (5 and 6 percent, respectively) and much lower than that of all immigrants (18 percent). Canadians were particularly likely to be covered by private health insurance (78 percent), while one-third were covered by public insurance programs such as Medicaid.
Figure 8. Health Coverage for Canadian Immigrants, All Immigrants, and the U.S. Born, 2023

Note: The sum of shares by type of insurance is likely to be greater than 100 because people may have more than one type of insurance.
Source: MPI tabulation of data from the U.S. Census Bureau’s 2023 ACS.
The Canadian diaspora in the United States was composed of more than 2.7 million individuals who were either born in Canada or as of 2023 reported Canadian ancestry or origin, according to Migration Policy Institute (MPI) tabulation of U.S. Census Bureau data.
Click here to see estimates of the largest diaspora groups in the United States.
The United States is overwhelmingly the most popular destination for emigration of Canadians, according to 2024 UN Population Division estimates. Other top destinations were the United Kingdom (81,800), Australia (57,200), Italy (23,300), and China (23,200).
Click here to view an interactive map showing where migrants from Canada and other countries have settled worldwide.
Migrants and other individuals worldwide sent approximately U.S. $847 million in remittances to Canada via formal channels in 2023, the most recent year for which the World Bank has updated estimates. This comprised less than 0.1 percent of the country’s gross domestic product (GDP).
Figure 9. Annual Remittance Flows to Canada, 2000-23

Source: MPI tabulation of data from the World Bank Global Knowledge Partnership on Migration and Development (KNOMAD), “Remittance Inflows,” updated April 15, 2025, available online.
Click here to view an interactive chart showing annual remittances received and sent by Canada and other countries.
Sources
Baskas, Harriet. 2025. More Canadians Avoid Setting Foot in the U.S., ‘without Even a Connection or Layover.’ NBC News, March 17, 2025. Available online.
Gibson, Campbell J. and Kay Jung. 2006. Historical Census Statistics on the Foreign-Born Population of the United States: 1850-2000. Working Paper no. 81, U.S. Census Bureau, Washington, DC, February 2006. Available online.
Immigration, Refugees, and Citizenship Canada. 2024. Supporting Cross-Border Mobility for Indigenous Peoples. Press release, October 10, 2024. Available online.
Institute of International Education (IIE). N.d. International Students: All Places of Origin. Accessed January 29, 2025. Available online.
Knowledge Partnership on Migration and Development (KNOMAD)/World Bank Group. 2025. Annual Remittances Data. Updated April 15, 2024. Available online.
Speer, Doris L. 2024. How Many Americans Live Abroad? Association of Americans Resident Overseas, October 2024. Available online.
U.S. Census Bureau. 2024. 2023 American Community Survey. Access from Steven Ruggles, Sarah Flood, Matthew Sobek, Daniel Backman, Annie Chen, Grace Cooper, Stephanie Richards, Renae Rodgers, and Megan Schouweiler. IPUMS USA: Version 15.0 [dataset]. Minneapolis, MN: IPUMS, 2024. Available online.
—. N.d. 2023 American Community Survey—Advanced Search: S0201 Selected Population Profile in the United States. Accessed January 10, 2025. Available online.
U.S. Department of Homeland Security (DHS), Office of Homeland Security Statistics (OHSS). 2024. 2023 Yearbook of Immigration Statistics. Washington, DC: DHS OHSS. Available online.
U.S. Embassy and Consulates in Canada. N.d. First Nations and Native Americans. Accessed June 3, 2025. Available online.