This post was originally published on this site
Top Statistics on Global Migration and Migrants

A woman at an airport looks at flight information. (Photo: Jacob Wackerhausen/iStock.com)
An individual’s decision to migrate across an international border is shaped by a multitude of personal and, often, global forces. In recent decades, the scale and complexity of global migration have continued to grow, reflecting the realities of an interconnected world where economic opportunity, political instability, demographic shifts, and environmental change influence who moves, where, and why.
In 2024, a record 304 million people lived in a country other than their country of birth, representing about 3.7 percent of the world’s 8.2 billion people, according to UN Population Division estimates. This is up from 275 million international migrants in 2020, who comprised 3.5 percent of the global population. To put this in perspective, if the population of international migrants was considered its own country, it would be the world’s fourth most populous, after India, China, and the United States.
While high-income countries, including in Europe, North America, and Oceania, remain top destinations, migration patterns have diversified, driven by regional labor demands, the expansion of global education pathways, and displacement due to conflict and crisis. At the same time, the gender, age, and labor-force profile of migrants has evolved.
This article draws on the most current and authoritative data sources to provide frequently sought statistics on international migration, highlighting types, the size of the migrant population and growth over time, and major sending and receiving countries and regions. In particular, this article uses data showcased in the International Migration Statistics section of the Migration Policy Institute’s (MPI) Migration Data Hub and a user-friendly compilation of more than 250 global and U.S. data sources called Immigration Data Matters.
Click on the bullet points to skip to a particular section:
- Size and Share
- Top Sending and Receiving Regions and Countries
- Migrant Workers
- Remittances
- International Students
- Refugees, Asylum Seekers, and Other Humanitarian Migrants
- Female Migrants
- Child Migrants
Size and Share
How many international migrants are there, now and historically?
There were a record 304 million global migrants as of mid-2024, representing about 3.7 percent of the world’s 8.2 billion people, according to the UN Population Division’s most recent estimates.
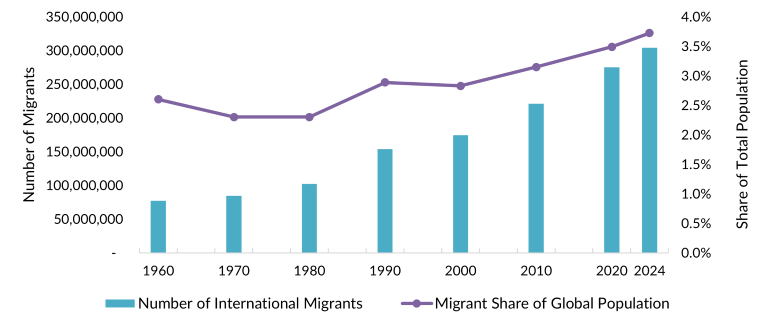
The 2024 international migrant population was almost double the 153.9 million in 1990 and nearly four times the 77.1 million in 1960 (see Figure 1). International migrants’ share of the global population represented a slight rise from 3.5 percent in 2020 and 2.6 percent in 1960. Between 2020 and 2024, the estimated number of global migrants grew by 10.4 percent, roughly tripling the increase in the world’s total population (3.5 percent).
Figure 1. Number and Share of Global Migrants, 1960-2024

Source: Migration Policy Institute (MPI) tabulation of data from the United Nations Department of Economic and Social Affairs (UN DESA), Population Division, “International Migrant Stock 2024: Table 1: International Migrant Stock at Mid-Year by Sex and by Region, Country or Area of Destination, 1990-2024,” and “International Migrant Stock 2024: “Table 3: International Migrant Stock as a Percentage of the Total Population by Sex and by Region, Country or Area of Destination, 1990-2024,” 2024, available online. Data prior to 1990 are no longer available online.
Top Sending and Receiving Regions and Countries
Which regions and countries host the largest numbers of migrants?
Most migrants choose to go to high-income countries such as the United States, Canada, or countries in Europe because of the greater economic and social stability on offer, as well as oil-producing countries in the Gulf which attract Asian and other migrants who come largely through temporary worker programs. In 2024, 155 million migrants resided in Europe and in North America, accounting for about 51 percent of all international migrants, according to UN data (see Table 1). The Northern Africa and Western Asia region was the next largest migrant destination, accounting for nearly 18 percent of the international migrant stock.
Table 1. Destinations of International Migrants, by Region and Share, 2024

Note: “Northern America” includes Bermuda, Canada, Greenland, Saint Pierre and Miquelon, and the United States. To see which countries are part of each region listed in the above table, click here.
Source: MPI tabulation of data from UN DESA Population Division, “International Migrant Stock 2024: Table 1: International Migrant Stock at Mid-Year by Sex and by Region, Country or Area of Destination, 1990-2024.”
The United States is the world’s top migrant destination, accounting for 17.2 percent of all migrants in 2024, even though it was home to just about 4.2 percent of the global population. Put differently, the more than 52 million migrants in the United States according to UN estimates was greater than the combined 51.5 million in the next four countries: Germany (which hosted 16.8 million, or 5.5 percent of all global migrants in 2024), Saudi Arabia (13.7 million, or 4.5 percent), the United Kingdom (11.8 million, or 3.9 percent), and France (9.2 million, or 3 percent).
While the United States has the largest absolute number of migrants, the foreign-born share of its overall population does not crack the top 25 globally. Here, Qatar and the United Arab Emirates lead the way: 76.7 percent and 74 percent, respectively, of their overall populations were foreign born as of 2024. Other countries such as Lichtenstein (69.5 percent), Switzerland (31.1 percent), Australia (30.4 percent), and Canada (22.2 percent) also well outpace international migrants’ share of the U.S. population (15.2 percent).
Note: In some cases, UN Population Division estimates of migrant stock do not match those provided by national statistical agencies. There could be several reasons for data differences, including periods referenced, definitions, and estimation methodologies. For instance, the U.S. Census Bureau’s most recent estimate of the foreign-born population is several million lower than the UN estimate because the Census Bureau considers persons born outside the United States and its dependent territories to a U.S.-citizen parent as “U.S. born,” whereas the UN Population Division defines them as born abroad.
Click here to see the number and share of international migrants for the top 25 destination countries, by number of migrants and their share of the total population, from 1960 to 2024.
What countries are the sources for the largest numbers of migrants?
In addition to being the largest destination regions, Europe and North America are also the origin regions for the largest number of migrants internationally, accounting for about 22 percent of all emigrants. Central and Southern Asia is the second largest migrant-origin region, followed by Latin America and the Caribbean (see Table 2).
Table 2. Origins of International Migrants, by Region and Share, 2024

Note: “Northern America” includes Bermuda, Canada, Greenland, Saint Pierre and Miquelon, and the United States. To see which countries are part of each region listed in the above table, click here.
Source: MPI tabulation of data from UN DESA Population Division, “International Migrant Stock 2024: Table 1: International Migrant Stock at Mid-Year by Sex and by Region, Country or Area of Origin, 1990-2024,” 2024, available online.
Among countries, India is the origin of the largest number of international migrants, accounting for 18.5 million emigrants (6.1 percent of all 304 million) in 2024. The other top origins were China (the origin of 11.7 million, or 3.8 percent), Mexico (11.6 million, or 3.8 percent), Ukraine (9.8 million, or 3.2 percent), and Russia (9.1 million, or 3 percent).
Click here to view an interactive map showing immigrant and emigrant populations by country of origin and destination.
Migrant Workers
How many migrant workers are there worldwide?
The number of international migrant workers stood at 167.7 million in 2022 (the most recent year for which data are available), or 4.7 percent of the global labor force, according to International Labor Organization estimates. Migrant workers can be found across all skill levels and sectors, however are often concentrated in lower-skilled industries such as agriculture, construction, and tourism.
Approximately 66 percent of all migrants of working age (15 and older) are in the labor force. Of these workers, men comprised the majority, accounting for 61 percent (or 102.7 million individuals), while women made up 39 percent (64.9 million).
Remittances
How much financial remittances do migrants and their relatives send?
Money sent by individual migrants and others to family and friends in the homeland, referred to as remittances, helps keep loved ones out of poverty, weather temporary economic or health crises, support children’s education, or serve a range of other purposes. In some cases, remittances can be an important source of investment in education, health, and infrastructure projects, as individuals’ funds are paired with government or international donor funds to carry out community-level improvements. Collectively, individuals send more money to low- and middle-income countries as remittances than governments allocate as foreign direct investment and official development assistance combined.
Officially recorded remittances sent via formal channels were expected to have reached a record of nearly $905 billion in 2024, according to World Bank projections, with households and communities in low- and middle-income countries receiving $685 billion (or 76 percent) of the total. The total remittances sent in 2024 amounted to an increase of 4.5 percent over 2023, the fourth year of growth following the slight dip in 2020 due to the COVID-19 pandemic.
Figure 2. Global Remittances Sent via Formal Channels, 2000-24

Note: Data for 2024 are an estimate.
Sources: Dilip Ratha, Sonia Plaza, and Eung Ju Kim, “In 2024, Remittance Flows to Low- and Middle-Income Countries Are Expected to Reach $685 Billion, Larger than FDI and ODA Combined,” World Bank blog post, December 18, 2024, available online.
Click here for an interactive map showing total remittance inflows and outflows by country since 1980.
What are the largest remittance-receiving countries?
The top five remittance-receiving countries in 2024 (not including high-income countries) were India (estimated $129.1 billion), Mexico ($68.2 billion), China ($48 billion), the Philippines ($40.2 billion), and Pakistan ($33.2 billion). Together, approximately $318.7 billion in remittances went to individuals or communities in these five countries, accounting for 47 percent of all officially recorded flows to low- and middle-income countries.
While the total value of remittances is significant, their relative impact varies. For example, remittances represented only about 3 percent of India’s gross domestic product (GDP) in 2024, but they play a much larger role in smaller, more aid-dependent countries. Measured as a share of GDP, the top remittance recipient was Tajikistan (where remittances accounted for 45 percent of GDP in 2024), followed by Tonga (38 percent), Nicaragua and Lebanon (27 percent each), and Samoa (26 percent).
Click here to view total remittance inflows and outflows by country since 1980.
Note: World Bank data only capture remittances sent through formal channels such as banks and money transfer operators. Currently, no uniform and authoritative historical data on informal flows exist. Given the widespread use of informal channels, the data should be regarded as underestimates of total flows.
International Students
How many international students are there worldwide?
There were 6.9 million students studying outside their country of origin in 2024, up from 4.5 million in 2014, according to the Institute of International Education. The top five destinations for international students were the United States (1.1 million), Canada (843,000), the United Kingdom (759,000), Australia (437,000), and France (412,000; see Figure 3). Combined, these countries hosted about 52 percent of all global students.
Figure 3. Host Countries of International Students, by Share, 2024

Source: Mirka Martel and Jonah Kokodyniak, Outlook 2030 Brief: Expanding International Study to the U.S. (Washington, DC: Institute of International Education, 2025), available online.
Refugees, Asylum Seekers, and Other Humanitarian Migrants
How many humanitarian migrants are there globally?
The number of people forcibly displaced worldwide (including refugees, asylum seekers, internally displaced persons [IDPs], refugees under the mandate of the UN Relief and Works Agency for Palestine Refugees [UNRWA], and other people in need of international protection) was more than 123.2 million at the end of 2024, according to the United Nations High Commissioner for Refugees (UNHCR). This was a record high, and included 36.8 million refugees under UNHCR mandate, 8.4 million asylum seekers, and 73.5 million IDPs. The forcibly displaced, who represent approximately 1.5 percent of the global population, are equivalent to the size of the 12th most populous country in the world: Japan.
Since 2000, the forcibly displaced population has tripled from approximately 38 million (see Figure 4).
Figure 4. Number of Humanitarian Migrants, 2000-24

Source: UN High Commissioner for Refugees (UNHCR), “Refugee Data Finder,” updated June 12, 2025, available online.
Click here to view an interactive map showing humanitarian migrant populations by origin and destination since 2000.
Female Migrants
How many women and girls are global migrants?
In 2024, 48 percent (146 million) of all international migrants were women or girls, according to UN estimates. The number of female migrants grew by 35.5 percent since 2010, up from 108 million. The number of male migrants grew by 39.5 percent during the same period.
Women and girls made up approximately half of refugees and other vulnerable humanitarian migrants.
Child Migrants
How many international migrants are children?
Approximately 13 percent (35.5 million) of the 280.6 million international migrants in 2020 (the most recent year for which age-specific data are available) were children under the age of 18, according to UN estimates. This was the most ever recorded, according to the International Data Alliance for Children on the Move.
Among forcibly displaced people, children account for a significantly larger share. Approximately 40 percent (48.8 million) of the 123.2 million forcibly displaced people were under age 18 as of the end of 2024, according to UNHCR estimates. Overall, 2.3 million children were born as refugees.
For more stats on various aspects of international migration, check out Immigration Data Matters, our useful online guide that takes users directly to more than 250 authoritative governmental and nongovernmental data sources by topic or region of interest. And as always:
Sources
International Data Alliance for Children on the Move (IDAC). 2022. Stronger Data, Brighter Futures: Protecting Children on the Move with Data and Evidence. New York: IDAC. Available online.
International Labor Organization (ILO). 2024. ILO Global Estimates on International Migrant Workers. Geneva: ILO. Available online.
Martel, Mirka and Jonah Kokodyniak. 2025. Outlook 2030 Brief: Expanding International Study to the U.S. Washington, DC: Institute of International Education (IIE). Available online.
Ratha, Dilip, Sonia Plaza, and Eung Ju Kim. 2024. In 2024, Remittance Flows to Low- and Middle-Income Countries Are Expected to Reach $685 Billion, Larger than FDI and ODA Combined. World Bank blog post, December 18, 2024. Available online.
UN Children’s Fund (UNICEF). 2021. Migration. Updated April 2021. Available online.
UN Educational, Scientific, and Cultural Organization (UNESCO), Institute for Statistics. N.d. Total Inbound Internationally Mobile Students, Both Sexes (Number). Accessed July 3, 2025. Available online.
UN High Commissioner for Refugees (UNHCR). 2025. Refugee Data Finder. Updated June 12, 2025. Available online.
—. 2025. Refugee Statistics. Updated April 2025. Available online.
UN Department of Economic and Social Affairs (UN DESA), Population Division. 2024. International Migrant Stock 2024. Available online.