This post was originally published on this site
Sub-Saharan African Immigrants in the United States

Young women outdoors. (Photo: iStock.com/PIKSEL)
Migration from sub-Saharan Africa to the United States has been on a significant upswing, in particular since the start of the 21st century, driven by economic opportunity, family reunification, and humanitarian protection reasons.
The first period of large-scale voluntary migration from sub-Saharan Africa began in the second half of the 20th century, after significant U.S. policy changes. The Immigration and Nationality Act of 1965 lifted country quotas that had limited migration from non-European countries. The Refugee Act of 1980 increased admissions of people fleeing conflict, including sizable numbers from the Democratic Republic of the Congo, Ethiopia, and Eritrea. And the Immigration Act of 1990 created the Diversity Visa to bolster immigration from under-represented countries, such as Cameroon and Chad. The 1990 law also made it easier for highly skilled immigrants to come for work, opening the door to many educated workers and international students from countries including Nigeria, South Africa, Kenya, and Ghana.
The 2.5 million immigrants from sub-Saharan Africa in 2024 represented well more than triple the number present in 2000. Sub-Saharan Africans accounted for 5 percent of all 50.2 million U.S. immigrants in 2024. This highly diverse group is comprised of individuals from a range of ethnic, linguistic, and educational backgrounds. While rates differ among nationalities, immigrants from sub-Saharan Africa are generally more likely than the overall foreign-born population to have become U.S. citizens, be active in the U.S. labor force, have arrived since 2010, and have higher educational attainment.
Whether the region’s growth trajectory continues remains to be seen. Some elements of U.S. policy under the Trump administration have generally restricted immigration from the region. The refugee resettlement program, an important pathway for many displaced people, has been largely put on hold since early 2025 and may resume in 2026 with far smaller numbers—reportedly just 7,500 places. And eight of the 19 nations included in the June 2025 travel ban are in sub-Saharan Africa, although current visa holders and others are exempt. Changes to visa reciprocity rules for people from Cameroon, Ethiopia, Ghana, and Nigeria may further limit legal arrivals.
This Spotlight provides information on the sub-Saharan African immigrant population in the United States, focusing on its size, geographic distribution, and socioeconomic characteristics.
Click on the bullet points below for more information:
- Size of Immigrant Population over Time and by Country
- Distribution by State and Key Cities
- English Proficiency
- Age, Education, and Employment
- Income and Poverty
- Immigration Pathways and Naturalization
- Unauthorized Immigrant Population
- Health Coverage
- Diaspora
- Top Global Destinations
- Remittances
Size of Immigrant Population over Time and by Country
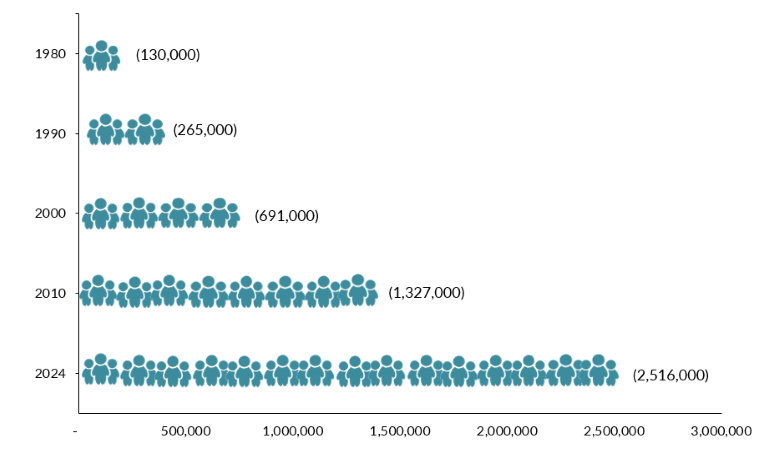
In 1980, there were about 130,000 sub-Saharan African immigrants in the United States. That population more than doubled to 265,000 by 1990 and has grown quickly in subsequent decades (see Figure 1). From 2010 to 2024, the number of sub-Saharan African immigrants grew by 90 percent, more than three times as fast as the overall U.S. foreign-born population (26 percent).
Figure 1. Sub-Saharan African Immigrant Population in the United States, 1980-2024

Sources: Data from U.S. Census Bureau’s 2010 and 2024 American Community Surveys (ACS), and Campbell J. Gibson and Kay Jung, “Historical Census Statistics on the Foreign-Born Population of the United States: 1850-2000” (Working Paper no. 81, U.S. Census Bureau, Washington, DC, February 2006), available online.
Roughly 56 percent of sub-Saharan Africans in the United States in 2024 were born in one of five countries: Nigeria, Ethiopia, Ghana, Kenya, or South Africa (see Table 1). Among groups with sizable populations, the fastest-growing from 2010 to 2024 were Nigerians (whose numbers grew by 143 percent, or 313,000 people), Cameroonians (142 percent), and Kenyans (105 percent).
Table 1. Sub-Saharan African Immigrants in the United States, by Country of Origin, 2024

Source: Migration Policy Institute (MPI) tabulation of data from the U.S. Census Bureau’s 2024 ACS.
Distribution by State and Key Cities
Many sub-Saharan African immigrants live in Texas or along the coasts. More than one-third were in Texas, Maryland, New York, or California as of the 2019-23 period. The top counties for sub-Saharan Africans were Harris County, Texas; Prince George’s County and Montgomery County, Maryland; Bronx County, New York; and Hennepin County, Minnesota. Together, these five counties were home to 14 percent of all sub-Saharan African immigrants in the United States.
Click here for an interactive map that highlights the states and counties with the highest concentrations of immigrants from sub-Saharan Africa or other regions.
The top cities for these immigrants are the greater Washington DC, New York, Dallas, Minneapolis, and Atlanta metropolitan areas. Slightly more than one-third of sub-Saharan African immigrants lived in one of these five cities as of 2019-23 (see Figure 2).
Figure 2. Top Metropolitan Destinations for Sub-Saharan African Immigrants in the United States, 2019-23

Note: Pooled 2019-23 ACS data were used to get statistically valid estimates at the metropolitan statistical-area level for smaller-population geographies. Not shown are the populations in Alaska and Hawaii, which are small in size. For details, visit MPI’s Migration Data Hub for an interactive map showing geographic distribution of immigrants by metro area, available online.
Source: MPI tabulation of data from U.S. Census Bureau’s pooled 2019-23 ACS.
Click here for an interactive map that highlights the metro areas with the most immigrants from sub-Saharan Africa or other regions.
Sub-Saharan Africans tend to be more proficient in English than the overall U.S. foreign-born population, yet most also likely speak a language other than English at home.
In 2024, 26 percent of sub-Saharan African immigrants ages 5 and over reported speaking English less than “very well,” compared to 47 percent of all immigrants.
Twenty-five percent reported speaking only English at home, compared to 16 percent of the total foreign-born population. Liberians and South Africans, both of whom have English as an official language in their origin countries, are much more likely to speak only English at home (68 percent and 56 percent, respectively) than other groups.
Age, Education, and Employment
In 2024, 80 percent of sub-Saharan African immigrants were of working age (18 to 64 years old), higher than the share of all immigrants (76 percent) or U.S. natives (58 percent). Sub-Saharan African immigrants were less likely to be minors (10 percent) or seniors over age 65 (10 percent) than the U.S. born (see Figure 3).
Figure 3. Age Distribution of the U.S. Population, by Origin, 2024

Note: Percentages may not add up to 100 as they are rounded to the nearest whole number.
Source: MPI tabulation of data from the U.S. Census Bureau’s 2024 ACS.
About 12 percent of sub-Saharan Africans ages 25 and older had less than a high school diploma as of 2024, versus 24 percent of all foreign-born adults and 7 percent of U.S.-born adults. Meanwhile, 46 percent of sub-Saharan African immigrants had a bachelor’s degree or higher, exceeding the rates of these other groups (see Figure 4). Sixty-seven percent of Nigerian immigrants were college graduates, as were most immigrants from South Africa (58 percent), Cameroon (54 percent), and Kenya (52 percent).
Figure 4. Educational Attainment of the U.S. Population (ages 25 and older), by Origin, 2024

Note: Percentages may not add up to 100 as they are rounded to the nearest whole number.
Source: MPI tabulation of data from the U.S. Census Bureau 2024 ACS.
Click here for data on immigrants’ educational attainment by country of origin and overall.
Nearly 56,800 students from sub-Saharan Africa were enrolled in U.S. graduate or undergraduate degree programs during the 2023-24 academic year, according to the Institute of International Education, making up 5 percent of the 1.1 million international students in the country overall.
Sub-Saharan African immigrants had a civilian labor force participation rate of 77 percent in 2024, significantly higher than that of both the overall foreign-born (68 percent) and U.S.-born (63 percent) populations. Among sub-Saharan African immigrants, Kenyans (81 percent) and Ghanaians, Liberians, and Nigerians (79 percent each) had some of the highest participation rates, while immigrants from Somalia had some of the lowest (70 percent).
A large share of sub-Saharan African immigrants was employed in management, business, science, and arts occupations (44 percent), followed by workers in service occupations (22 percent) and production, transportation, and material moving occupations (18 percent). This distribution mirrors the distribution of all U.S. foreign-born workers.
Figure 5. Employed Workers in the Civilian Labor Force (ages 16 and older), by Occupation and Origin, 2024

Note: Percentages may not add up to 100 as they are rounded to the nearest whole number.
Source: MPI tabulation of data from the U.S. Census Bureau’s 2024 ACS.
Among sub-Saharan African immigrants, people from South Africa reported some of the highest median household incomes in 2024 ($120,800), followed by households led by Kenyans ($92,200) and Cameroonians ($91,400). Somalis ($46,800) had among the lowest median household incomes. For comparison, the median household income for the overall U.S. immigrant population was about $82,400; for U.S.-born households it was $81,400.
In 2024, 15 percent of sub-Saharan Africans lived below the poverty line, compared to 14 percent of all immigrants and 12 percent of U.S.-born residents. Poverty rates were higher among Somalis (25 percent) and lower among immigrants from Ghana (11 percent). (The U.S. Census Bureau defines poverty as having an income below $32,100 for a family of four in 2024.)
Immigration Pathways and Naturalization
As of 2024, about 60 percent of sub-Saharan African immigrants were naturalized U.S. citizens, compared to 51 percent of immigrants overall. Immigrants from Somalia (83 percent) were more likely to be naturalized than those from places including Cameroon (54 percent) and South Africa and Nigeria (59 percent each).
This high naturalization share is especially notable given that many sub-Saharan African immigrants arrived recently. Approximately 54 percent of sub-Saharan Africans arrived in the United States since 2010, compared to 38 percent of immigrants overall (see Figure 6). Immigrants from Cameroon (65 percent) and Nigeria (57 percent) were more likely than others to have arrived since 2010.
Figure 6. Sub-Saharan African and All Immigrants in the United States, by Period of Arrival, 2024

Note: Percentages may not add up to 100 as they are rounded to the nearest whole number.
Source: MPI tabulation of data from the U.S. Census Bureau’s 2024 ACS.
Forty-eight percent of the 79,000 immigrants from sub-Saharan Africa who became lawful permanent residents (LPRs, also known as green-card holders) in fiscal year (FY) 2023 did so as immediate relatives of U.S. citizens. About 7 percent obtained a green card through other types of family sponsorship, 16 percent did so after being resettled as a refugee or being granted asylum, and another 16 percent received their green card through the Diversity Visa program. The remaining 12 percent of new green-card holders obtained the status through employment-based sponsorship.
Most new LPRs in FY 2023 from the Central African Republic (91 percent), Burundi (68 percent), and Tanzania (65 percent) obtained their green cards by adjusting from refugee or asylee status. The Diversity Visa lottery program was a significant route for immigrants from Chad (accounting for 63 percent of new green cards), Angola (49 percent), and Togo (46 percent).
Unauthorized Immigrant Population
The Migration Policy Institute (MPI) estimates that about 356,000 (3 percent) of all 13.7 million unauthorized immigrants in the United States as of mid-2023 were from sub-Saharan Africa.
Click here for an MPI overview of the unauthorized immigrant population in the United States as of mid-2023.
Some sub-Saharan African immigrants have been in the United States with Temporary Protected Status (TPS), which grants work authorization and relief from deportation. Ethiopia, Somalia, and South Sudan were among the countries with current TPS designations as of this writing; nearly 5,500 nationals of these countries had been approved for TPS as of March 2025, accounting for a small proportion of all 1.3 million TPS holders. TPS status for Cameroonians was terminated in early August, although litigation over the termination was ongoing as of this writing.
An estimated 2,640 sub-Saharan Africans as of December 2024 were beneficiaries of the Deferred Action for Childhood Arrivals (DACA) program, which provides temporary deportation relief and work authorization to unauthorized immigrants who arrived as children and meet the program’s education and other eligibility criteria. This population represented less than 1 percent of all 533,300 active DACA recipients. Among these DACA holders were 720 Nigerians, 450 Kenyans, and 320 Ghanaians.
Click here to view the top origin countries of DACA recipients and their U.S. states of residence.
Sub-Saharan African immigrants were slightly less likely than immigrants overall to lack health insurance as of 2024 (14 percent versus 18 percent, respectively; see Figure 7).
Figure 7. Health Coverage for Sub-Saharan African Immigrants, All Immigrants, and the U.S. Born, 2024

Note: The sum of shares by type of insurance is likely to be greater than 100 because people may have more than one type of insurance.
Source: MPI tabulation of data from the U.S. Census Bureau’s 2024 ACS.
The sub-Saharan African diaspora is comprised of close to 4.8 million U.S. residents who were either born in sub-Saharan Africa or reported sub-Saharan African ancestry, according to MPI tabulation of data from the U.S. Census Bureau’s 2023 American Community Survey.
The Nigerian diaspora is the largest from the region, with close to 905,000 members, followed by the 412,000 U.S. residents who have links to Ethiopia and 332,000 with ties to Ghana.
Click here to see estimates of the 35 largest diasporas groups in the United States in 2023.
While the United States is a major destination for sub-Saharan Africans, most who are leaving their country of origin opt to move to other countries in sub-Saharan Africa, due to these places’ proximity, cultural similarities, and relatively low cost of living. Former colonial powers including France and the United Kingdom are also popular choices, as are Canada and other countries.
Click here to view an interactive map showing where migrants from sub-Saharan African and other countries have settled worldwide.
Migrants and other individuals worldwide sent approximately $54.3 billion in remittances via formal channels to sub-Saharan African countries in 2024, an 80 percent increase since 2010, according to World Bank estimates.
Figure 8. Annual Remittance Flows to Sub-Saharan Africa, 2000-24

Note: Data for 2024 are an estimate.
Source: Dilip Ratha, Sonia Plaza, and Eung Ju Kim, “In 2024, Remittance Flows to Low- and Middle-Income Countries Are Expected to Reach $685 Billion, Larger than FDI and ODA Combined,” World Bank blog post, December 18, 2024, available online.
Some sub-Saharan African economies are more dependent on remittances than others. Remittances sent via formal channels accounted for 21 percent of the gross domestic product (GDP) of both The Gambia and Lesotho in 2024. Although the largest total remittances to the region went to Nigeria ($19.8 billion), which is the second largest sub-Saharan African economy (after South Africa), these transfers accounted for 8 percent of its GDP.
Click here to view an interactive chart showing annual remittances received and sent by sub-Saharan African countries and others.
Sources
American Immigration Council. 2025. Trump’s 2025 Travel Ban: Who Is Affected and What It Could Cost the U.S. Economy. Washington, DC: American Immigration Council. Available online.
American Immigration Lawyers Association (AILA). 2025. Practice Alert: TPS and Parole Status Updates Chart. Updated October 6, 2025. Available online.
Connor, Phillip. 2018. International Migration from Sub-Saharan Africa Has Grown Dramatically Since 2010. Pew Research Center short read, February 28, 2018. Available online.
Gibson, Campbell J. and Kay Jung. 2006. Historical Census Statistics on the Foreign-Born Population of the United States: 1850-2000. Working Paper no. 81, U.S. Census Bureau, Washington, DC, February 2006. Available online.
Institute of International Education (IIE). N.d. International Students: All Places of Origin. Accessed September 15, 2025. Available online.
International Organization for Migration (IOM). 2024. World Migration Report 2024. Geneva: IOM. Available online.
McEwan, Natalie L. and Larkin Dykstra. 2025. Major Changes to U.S. Visa Reciprocity for Nationals of Four African Countries. Ogletree Deakins blog post, July 23, 2025. Available online.
Ratha, Dilip, Sonia Plaza, and Eung Ju Kim. 2024. In 2024, Remittance Flows to Low- and Middle-Income Countries Are Expected to Reach $685 Billion, Larger than FDI and ODA Combined. World Bank blog post, December 18, 2024. Available online.
UN Population Division. 2024. International Migrant Stock 2024 by Destination and Origin. Available online.
U.S. Census Bureau. 2024. 2024 American Community Survey. Access from Steven Ruggles, Sarah Flood, Matthew Sobek, Daniel Backman, Annie Chen, Grace Cooper, Stephanie Richards, Renae Rodgers, and Megan Schouweiler. IPUMS USA: Version 15.0 [dataset]. Minneapolis, MN: IPUMS, 2024. Available online.
—. N.d. 2024 American Community Survey—Advanced Search: S0201 Selected Population Profile in the United States. Accessed October 1, 2025. Available online.
U.S. Citizenship and Immigration Services (USCIS). 2025. Count of Active DACA Recipients by Month of Current DACA Expiration as of December 31, 2024. Updated February 2025. Available online.
U.S. Department of Homeland Security (DHS), Office of Homeland Security Statistics (OHSS). 2024. 2023 Yearbook of Immigration Statistics. Washington, DC: DHS OHSS. Available online.
Wilson, Jill H. 2025. Temporary Protected Status and Deferred Enforced Departure. Washington, DC: Congressional Research Service (CRS). Available online.