This post was originally published on this site
International Students in the United States

A graduation ceremony at the University of Delaware. (Photo: Adam Schultz/White House)
Globally, the United States has long been the top destination for international students, with more than 1.1 million enrolled in U.S. higher education during the 2023-24 academic year—the largest single-country enrollment number on record. The United States hosted approximately 16 percent of the world’s 6.9 million international students that year, well ahead of other major destinations.
However, the United States’ dominance in this sector has been declining over the past decade. The U.S. share of global international students has dropped from about 20 percent of the worldwide total of 4.5 million students in 2013-14. Several factors have contributed to this decline, including rising U.S. higher education costs, expanded study opportunities in other countries, and student visa delays and denials, compounded by limited embassy access and global travel restrictions during the COVID-19 pandemic. With the Trump administration’s heightened scrutiny of international students, attempts to block Harvard’s ability to enroll foreign students, revocation of some student visas, and a ban or restriction on visas for nationals from 19 countries, it remains to be seen how these actions might affect future enrollment rates. While the number of new foreign students has fluctuated over the past decade, the new restrictions may create chilling effects on future international student flows to the United States.
The administration has also discussed eliminating Optional Practical Training (OPT), which allows students to work in their field of study postgraduation for 12-36 months (depending on the field); it also is considering limiting the duration of student and exchange visitor visas. These changes and proposals have reduced some eligibility and enrollment, as well as introduced new uncertainty for university administrators and college students alike.
This Spotlight provides information on international students enrolled in U.S. colleges and universities in the 2023-24 school year (the most recent year for which complete data are available), focusing on the population’s size, distribution within the United States, and other characteristics. Data on international students in the United States include those enrolled in educational institutions as well as graduates who remain on a student visa for OPT.
Click on the bullet points below for more information:
- Student Visa Holders
- Enrollment Numbers and Trends
- Geographic Distribution and Leading Institutions
- Countries of Origin
- Fields of Study
- Funding and Economic Impact
- Transition into the U.S. Labor Market
- Top Global Destinations
In the wake of the discovery that one of the 9/11 hijackers had entered the United States on a student visa but never attended class, the Department of Homeland Security (DHS) in 2003 implemented a program to collect, maintain, and manage information about all foreign students and exchange visitors in the United States. The program, called the Student and Exchange Visitor Information System (SEVIS), tracks and monitors schools, programs, students, exchange visitors, and their dependents throughout the duration of approved participation in the U.S. education system. As part of SEVIS, all schools are required to submit and regularly update student information in a central database that can be accessed by the government; students who do not appear or who stop attending classes can have their visas revoked and face deportation.
Close to 1.6 million F-1 and M-1 students were enrolled in SEVIS-certified schools in calendar year 2024, a 5 percent increase from 2023. Meanwhile, the 301,000 J-1 visiting students in 2024 were largely the same as the 299,000 in 2023. There were about 7,200 SEVIS-certified schools in 2024, down from about 7,700 in 2023 and 8,600 in 2019.
The following sections focus specifically on international students who were either enrolled in U.S. colleges and universities or participating in OPT. Estimates are based on an annual survey of U.S. schools conducted by the Institute of International Education (IIE), which are slightly different from SEVIS estimates.
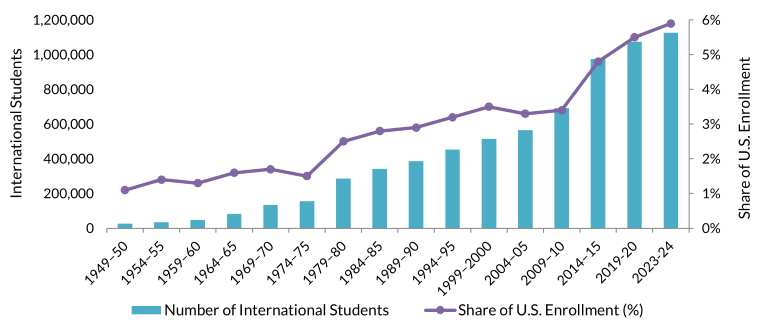
The number of international students enrolled in U.S. colleges and universities has grown significantly over the past 70 years (see Figure 1). While just 26,000 international students were pursuing a degree in the United States in the 1949-50 school year, that number had grown to an all-time high of more than 1.1 million in 2023-24, with an additional 18,000 international students working towards a U.S. degree online from abroad. Within the last decade, the number of international students fell briefly due to tightened visa screening coupled with travel restrictions during the first Trump administration and processing delays during the COVID-19 pandemic, before subsequently recovering as the public-health crisis waned and the Biden administration relaxed restrictions.
Figure 1. International Students and Share of Total U.S. Enrollment (%), 1949-50 to 2023-24

Source: Institute of International Education (IIE), “Enrollment Trends,” accessed June 20, 2025, available online.
International students also increased as a share of all students enrolled in U.S. higher education, from 1 percent of all 2.4 million U.S. students in 1949-50 to almost 6 percent of all 18.9 million students in 2023-24. However, relative to other top destinations for international students, this share is small. International students represented 38 percent of Canadian university enrollment in 2024, 31 percent in Australia, and 27 percent in the United Kingdom.
Growth in U.S. international student enrollment has slowed over the past decade. The number of international students in U.S. colleges and universities grew by 16 percent from 2014-15 to 2023-24, versus 57 percent in the decade that preceded.
Similarly, the proportion of international students who were new to the United States has fluctuated from a recent high of 30 percent in 2013-14 to a low of 16 percent in 2020-21, before gradually increasing to 27 percent in 2023-24. Over the same period, the share of students participating in OPT nearly doubled, from 12 percent to 22 percent.
Figure 2. International Students in the United States by Type of Enrollment and Program Participation, 2013-14 to 2023-24

Sources: IIE, “Enrollment Trends;” IIE, “New International Student Enrollment,” accessed June 20, 2025, available online.
Lack of significant growth in the number of new international students at U.S. institutions has been a concern on U.S. campuses. While the number of new international student enrollments rebounded to about 262,000 as the world recovered from the pandemic, it has been essentially flat the last two years, at about 299,000 (see Figure 3).
Figure 3. Annual Change in New International Student U.S. Enrollment, Fall 2014 to Fall 2023

Source: IIE, “Enrollment Trends.”
Geographic Distribution and Leading Institutions
In the 2023-24 academic year, approximately one in three international students studied in either California, New York, or Texas (see Table 1). Other leading host states were Massachusetts, Illinois, and Pennsylvania. International students are more evenly spread across the country than immigrants overall; for instance, California is home to about 13 percent of international students but accounts for about 22 percent of the total foreign-born population.
Table 1. Top U.S. States of Residence for International Students and All Immigrants, 2023-24

Sources: IIE, Open Doors: Report on International Educational Exchange, 2024 Fast Facts (Washington, DC: IIE, 2024), available online; U.S. Census Bureau, “2023 American Community Survey—Advanced Search,” accessed June 25, 2025, available online.
New York University has been the leading U.S. university for international students since the 2013-14 school year. Northeastern University’s campus in Boston rose to the second spot in the 2019-20 school year, and Columbia University has been in third place since 2020-21. Nationally, these three universities enrolled 6 percent of the 1.1 million international students in 2023-24 (see Table 2). Overall, the top ten institutions enrolled more than 167,000 international students, or 15 percent of the total population. Harvard, whose ability to enroll international students has been revoked by the Trump administration (the matter remains under legal challenge as of this writing), is outside the top 25 host institutions, with just under 6,800 enrolled there in the 2023-24 school year.
Table 2. Top U.S. Institutions by Number of Enrolled International Students, 2023-24

Source: IIE, “Leading Institutions,” accessed June 20, 2025, available online.
For the first time in 15 years, India was the top origin for international students in the 2023-24 school year, representing 29 percent of the more than 1.1 million students from abroad. It was followed by the prior top sending country, China (25 percent), and then, with a big gap, South Korea (4 percent), Canada (3 percent), and Taiwan (2 percent; see Table 3). The trends in the number of students from India and China diverged at the start of the pandemic: The number of Chinese students has fallen since the 2020-21 school year, while those from India and other top origin countries have risen. From school year 2021-22 to 2023-24, the number of Chinese students fell by 4 percent, while the number from India increased by 66 percent, enrollment from Bangladesh increased by 61 percent, and arrivals from Nepal grew by 42 percent. The total number of international students rose 19 percent over these two years.
Table 3. Top Origin Countries of International Students in the United States, 1949-50, 2021-22, and 2023-24

Note: Data for China do not include Hong Kong and Macao.
Source: IIE, “All Places of Origin,” accessed June 25, 2025, available online.
The major origins of international students have changed significantly over time. In the 1949-50 school year, Canada, Taiwan, India, and several European and Latin American countries were the largest sending countries. Following passage of the Immigration and Nationality Act of 1965, which removed national-origin quotas, as well as amid rising educational levels and socioeconomic standing in many countries, recent top sending countries have included several from Asia as well as Nigeria.
Math and computer science, engineering, and business and management were the top three fields of study for international students in 2023-24, accounting for 58 percent of all international enrollment at U.S. higher education institutions (see Figure 4). Notably, 56 percent of international students were in science, technology, engineering, or mathematics (STEM) fields and were therefore eligible for an extended 36-month OPT upon graduation.
Figure 4. Fields of Study of International Students in the United States, 2023-24

Note: Science, technology, engineering, and math (STEM) fields are denoted with *.
Source: IIE, “Fields of Study,” accessed June 25, 2025, available online.
All fields of study have experienced growth in international enrollment post-pandemic. Between school years 2021-22 and 2023-24, the number of math and computer sciences students increased by 40 percent, the number in intensive English programs increased by 33 percent, and those in health profession programs increased by 14 percent.
Students from different countries tend to pursue different majors. For instance, most students from Iran and India (76 percent each), Nepal (72 percent), and Bangladesh (71 percent) studied STEM fields in the in 2023-24 school year, versus just 22 percent of those from Japan and 25 percent from Germany. Close to one-quarter of students from Spain, Germany, and Vietnam studied business and management. And about 12 percent of students from Canada and 11 percent from Nigeria were pursuing degrees in the health field.
In 2023-24, just over 57 percent of international students received most of their educational funding from sources outside the United States: about 55 percent relied on personal and family funds and slightly less than 3 percent primarily used foreign government or foreign university aid or a foreign private sponsor. The remaining 43 percent financed their education primarily through current employment (22 percent), U.S. university aid (19 percent), or other sources (2 percent).
International students contributed nearly about $43.8 billion to the U.S. economy during the 2023-24 academic year and supported more than 378,000 jobs, according to estimates from NAFSA: Association of International Educators. Globally, the international education sector is estimated to be worth hundreds of billions of dollars annually.
Transition into the U.S. Labor Market
Postgraduation, availability of work visas has always been the main barrier for international students wishing to stay in the United States.
The number of international students remaining after their studies through the OPT program has increased over time, although growth has slowed in recent years. In the 2023-24 academic year, there were about 242,800 people in the OPT program, an increase of nearly 44,000 students from a year before, in big part driven by the higher numbers of STEM students who are eligible for longer OPT.
Both the original OPT option available to all international graduates and the additional 24-month extension available to STEM international graduates could be eliminated or curtailed at the discretion of the administration. Should the Trump administration abolish OPT altogether, the impact would be far-reaching. Among those affected would be foreign-born students who value U.S. work experience, student entrepreneurs who found or join start-ups, colleges and universities that host these students, and U.S. employers including Amazon, Google, and Microsoft, which hire the largest numbers of STEM OPT students.
The United States is the top destination for international students worldwide. Other top destinations for the 6.9 million international students in 2024 were Canada (12 percent), the United Kingdom (11 percent), and Australia and France (6 percent apiece), according to estimates by the Institute of International Education (see Table 4).
Table 4. Top Global Destinations for International Students, 2024

Source: Mirka Martel and Jonah Kokodyniak, Outlook 2030 Brief: Expanding International Study to the U.S. (Washington, DC: IIE, 2025), available online.
Sources
Baer, Julie and Mirka Martel. 2020. Fall 2020 International Student Enrollment Snapshot. Washington, DC: Institute of International Education (IIE). Available online.
Collett, Elizabeth. 2025. International Student Mobility: A Post-Pandemic Reset or a Broader Challenge? Washington, DC: Migration Policy Institute (MPI). Available online.
Feng, Emily. 2025. Rubio Says U.S. Will ‘Aggressively’ Revoke Visas for Many Chinese Students. National Public Radio (NPR), May 28, 2025. Available online.
Glass, Chris. 2025. The US Underreported the Number of International Students by 200,000 Last Year. LinkedIn post, July 7, 2025. Available online.
Institute of International Education (IIE). 2024. Open Doors: Report on International Educational Exchange. Washington, DC: IIE. Available online.
—. 2024. United States Hosts More than 1.1 Million International Students at Higher Education Institutions, Reaching All-Time High. Press release, November 18, 2024. Available online.
Martel, Mirka and Jonah Kokodyniak. 2025. Outlook 2030 Brief: Expanding International Study to the U.S. Washington, DC: IIE. Available online.
NAFSA: Association of International Educators. 2024. International Students Contribute Record-Breaking Level of Spending and 378,000 Jobs to the U.S. Economy. Press release, November 18, 2024. Available online.
U.S. Census Bureau. N.d. 2023 American Community Survey—Advanced Search. Accessed June 25, 2025. Available online.
U.S. Immigration and Customs Enforcement (ICE). 2025. SEVIS by the Numbers: Annual Report on Foreign Student Trends. Washington, DC: ICE. Available online.
U.S. State Department. N.d. Report of the Visa Office 2024. Accessed July 14, 2025. Available online.