Refugees and Asylees in the United States

A refugee from the Democratic Republic of the Congo who was resettled in the United States. (Photo: © UNHCR/Nicolo Filippo Rosso)
More than 117 million people globally had been displaced from their homes by conflict or other crises as of mid-2025, up from 81 million in 2020. While the level of humanitarian protection worldwide is near a historical high, the United States has experienced significant fluctuations in refugee resettlement and asylum processing in recent years, with sharply divergent policy approaches between different U.S. presidential administrations resulting in significantly different outcomes for individuals seeking refuge.
Upon returning to office in 2025, the Trump administration restricted refugee, asylum, and other humanitarian immigration programs. It initially suspended the U.S. refugee resettlement program, although it later resettled a small number of White South Africans. The administration then set the refugee admissions ceiling at 7,500 for fiscal year (FY) 2026, the lowest in the program’s 45-year history. This followed a period of gradual increase in U.S. refugee resettlement under President Joe Biden, reaching a high of more than 100,000 admissions in FY 2024, after record lows during President Donald Trump’s first term. Historically, the United States has resettled more refugees annually than any other country.
In December 2025, the Trump administration also paused decisions on many asylum cases, which are filed by people seeking protection at a U.S. port of entry or from within the country (unlike refugees, whose protection claims are considered while they are outside the United States). The administration’s decision followed a surge in grants of asylum, with nearly 54,400 people given asylum in FY 2023 (the most recent year for which data are available). It also terminated humanitarian parole programs for nationals of select countries that offer temporary protection from deportation and access to a work permit.
These and other policy changes have created significant uncertainty for individuals seeking protection as well as the nonprofit organizations that work to resettle and integrate them into U.S. communities. Notably, the U.S. policy changes occurred within a broader global context, as governments across high-income countries drastically cut foreign aid and development support in 2025, with humanitarian aid globally down 40 percent from 2024 as of midyear.
This Spotlight examines characteristics of the U.S. refugee and asylee populations, including top countries of origin and top states for refugee resettlement, using the most recent data available from the State Department and the Department of Homeland Security (DHS).
Note: All yearly data are for the government’s fiscal year (October 1 through September 30) unless otherwise noted.
Click on the bullet points below for more information:
- Refugee Admissions Ceiling
- Refugee Arrivals by Region and Country of Origin
- Refugees from Predominately Muslim Countries
- Refugees from Latin America and the Caribbean
- Top Refugee-Receiving States
- Asylees
- Asylum Backlogs
- Adjustments to Lawful Permanent Resident Status
- Temporary Humanitarian Programs
Refugees
At the beginning of each fiscal year, the president, in consultation with Congress, sets a cap on the number of refugees to be resettled from five global regions, as well as an unallocated reserve to be used if a country goes to war or more refugees need to be admitted regionally. In the case of an unanticipated emergency, the total and regional allocations may be adjusted.
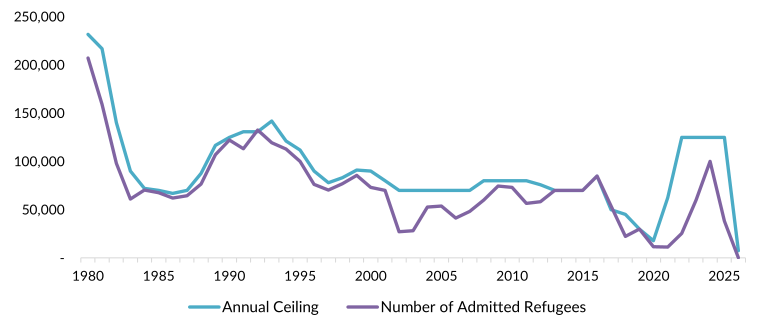
In the first year after creation of the modern refugee resettlement program, the initial refugee admissions ceiling was set at 231,700 for FY 1980 (see Figure 1). It declined through the decade and then increased to 142,000 in FY 1993, largely as a response to the Balkan wars, before settling in the range of approximately 70,000-90,000 from the late 1990s to FY 2016. In response to a worsening global humanitarian situation, the Obama administration raised the ceiling to 110,000 in FY 2017, although the first Trump administration reduced it to 50,000 upon taking office and continued to lower it further. The Biden administration sought to revive the refugee resettlement program and raised the annual cap to 125,000 for FY 2022-25. The FY 2026 ceiling of 7,500, set by the second Trump administration, is the lowest in the history of the resettlement program.
The number of refugees who are resettled is typically below the legal cap. The 100,034 resettlements in FY 2024 were the highest post-FY 1994, but still short of the 125,000 ceiling. In the first three months of FY 2026 (the most recent data available as of this writing), just 720 refugees had been resettled in the United States.
Figure 1. Annual Refugee Resettlement Ceiling and Number of Refugees Admitted to the United States, FY 1980-2026*

* Data for refugee resettlement in fiscal year (FY) 2026 cover only the first three months of the year.
Notes: The FY 2017 refugee ceiling was originally set at 110,000 but was lowered to 50,000 midyear; the FY 2021 refugee ceiling was originally 15,000 but was increased to 62,500 midyear.
Sources: U.S. Departments of State, Homeland Security, and Health and Human Services, “Proposed Refugee Admissions for Fiscal Year,” various years; Migration Policy Institute (MPI) analysis of data from the State Department’s Worldwide Refugee Admissions Processing System (WRAPS), available online.
Click here to view an interactive chart on refugee admissions over time.
Refugee Arrivals by Region and Country of Origin
The origins of admitted refugees have changed considerably over time (see Figure 2).
Of the refugees resettled in FY 2025, 34 percent came from the Middle East and South Asia, 32 percent were from Africa, 22 percent from Latin America and the Caribbean, 10 percent from East Asia, and 2 percent from Europe and Central Asia. In comparison, Africa was the leading origin of resettled refugees from FY 2018 through FY 2024, with the continent representing the origin for as much as 55 percent of refugees in FY 2019 and FY 2021. Refugees from Europe and Central Asia accounted for 22 percent of resettlements in FY 2020, while those from Latin America and the Caribbean made up no more than 8 percent from FY 2006 through FY 2021.
Figure 2. Regions of Origin of U.S. Refugee Arrivals, FY 2000-25

Notes: Regions are as reported in the original WRAPS data; Family members granted follow-to-join refugee status are included in refugee admissions data; recipients of Special Immigrant Visas (SIV) who received refugee program reception and placement benefits are not included.
Source: MPI analysis of State Department WRAPS data.
Nationals of Afghanistan, the Democratic Republic of the Congo (DRC), and Venezuela were the top three origin groups in FY 2025, collectively representing 45 percent of arrivals (approximately 17,000 individuals). In comparison, in FY 2015, nationals of Myanmar (also known as Burma), Iraq, and Somalia were the top three groups, representing 57 percent of arrivals (more than 39,900 individuals).
Five countries—DRC, Eritrea, Myanmar, Somalia, and Syria—were among the top ten refugee origins in both FY 2015 and FY 2025 (see Table 1). Of the 720 resettlements in FY 2026 as of this writing, 717 were from South Africa and three from Afghanistan.
Table 1. Origins of U.S. Refugee Arrivals, FY 2015 and FY 2025

Source: MPI analysis of State Department WRAPS data.
Refugees from Predominately Muslim Countries
Refugees and other immigrants from predominantly Muslim countries have been a flashpoint for the Trump administration during both terms. During the first term, the administration suspended the resettlement of Syrian refugees, temporarily paused all refugee resettlement, and barred entry to noncitizens from seven Muslim-majority nations—Iran, Iraq, Libya, Somalia, Sudan, Syria, and Yemen. The administration’s travel ban, sometimes referred to as the “Muslim ban,” went through several iterations, chiefly in response to court rulings, and contributed to a drop in arrivals from these countries through humanitarian and other immigration channels. Revoked by the Biden administration in early 2021, the travel ban and related travel restrictions found new life in the second Trump term, first targeting 19 countries in June 2025 and then expanding later in the year. As of this writing, nationals from 39 countries faced an outright travel ban or restrictions on their ability to enter the United States.
Several Muslim-majority countries on the list are among the largest traditional origins of U.S.-bound refugees, including Afghanistan, Syria, and Somalia. Overall, 43 percent of the 38,100 refugees resettled in FY 2025 were nationals of one of the countries in the full or partial travel ban wherein Muslims make up roughly half or more of the population: Afghanistan, Burkina Faso, Chad, Côte d’Ivoire, Eritrea, the Gambia, Iran, Libya, Mali, Mauritania, Niger, Nigeria, Senegal, Sierra Leone, Somalia, Sudan, Syria, Turkmenistan, and Yemen.
Refugees from Latin America and the Caribbean
In the past, refugee resettlement to the United States from Latin America and the Caribbean had been consistently low. However, the last several years have seen a significant increase in the number of refugees resettled from this region.
Historically, Cubans have been the largest refugee group from the Western Hemisphere, in large part due to their ability since 1987 to be processed for refugee status from within Cuba, among other special considerations for those fleeing the communist regime. In FY 2015, more than 1,500 Cubans were resettled as refugees in the United States. However, numbers have fallen dramatically since then, following efforts by the Obama administration to normalize relations with Havana and other developments. In FY 2025, only 130 refugees arrived from Cuba through the formal refugee resettlement channels.
Meanwhile, Venezuela became the third largest refugee-origin country, responsible for approximately 4,600 refugees in FY 2025, or 55 percent of all those from Latin America and the Caribbean. Political and economic crises have driven close to 8 million people from Venezuela since 2015, the vast majority (6.9 million) relocating within Latin America and the Caribbean, primarily Colombia, Peru, Brazil, Chile, and Ecuador. Both Venezuela and Cuba were on the travel ban list as of this writing.
Figure 3. Origins of U.S. Refugee Arrivals from Latin America and the Caribbean, FY 2025

Source: MPI analysis of State Department WRAPS data.
Resettled refugees are placed in U.S. communities based on factors including their individual needs and family ties, and the receiving community’s language and health-care services, housing availability, educational and job opportunities, and cost of living. In FY 2025, refugees’ top initial resettlement destinations were Texas (approximately 10 percent, or 3,900 individuals), California (8 percent, or 3,000 individuals), and New York (6 percent, or 2,400 refugees; see Figure 4). Other notable states of resettlement were Florida, Pennsylvania, Ohio, Illinois, Georgia, and Minnesota, followed by North Carolina. Fifty-one percent of all refugee resettlements during the period were to one of these ten states.
Figure 4. Refugee Arrivals by Initial U.S. State of Residence, FY 2025

Note: The data reflect refugees’ first state of resettlement and do not track onward movement.
Source: MPI analysis of State Department WRAPS data.
The nationalities of resettled refugees can vary greatly by state. For example, refugees from Afghanistan—the largest group admitted in FY 2025—comprised the top group in nine states (California, Colorado, Connecticut, Delaware, Maryland, Nebraska, Rhode Island, Virginia, and Washington) as well as the District of Columbia. Refugees from DRC made up the largest groups in 12 states (Arizona, Idaho, Iowa, Kansas, Kentucky, Massachusetts, Missouri, New Hampshire, North Dakota, Ohio, Tennessee, and Vermont). Venezuelans were top in nine states (Alabama, Alaska, Arkansas, Florida, Nevada, New Jersey, New Mexico, Texas, and Utah).
Asylees
In FY 2023 (the most recent data provided by the government), close to 54,400 people were granted asylum, the most in at least decade. Of these new asylees, 59 percent (more than 32,000 individuals) were granted asylum defensively, while the remaining 41 percent (22,300 individuals) were granted asylum affirmatively. (See Box 3 for the differences between affirmative and defensive asylum.) Additionally, 4,790 individuals were granted derivative asylum status within the United States as immediate family members of principal asylum applicants, while 13,930 individuals obtained derivative status outside the country. (Note: This reflects the number of travel documents issued to family members residing abroad, not their actual arrival to the United States.) Nationals of Afghanistan, China, and Venezuela accounted for 43 percent (23,100) of people granted asylum in FY 2023 (see Table 2).
Table 2. Affirmative, Defensive, and Total Grants of Asylum, by Nationality, FY 2023

Source: U. S. Department of Homeland Security (DHS) Office of Homeland Security Statistics, 2023 Yearbook of Immigration Statistics, available online.
From FY 2014 through FY 2023, nearly 316,500 people were granted asylum. Chinese were by far the largest group, accounting for 17 percent of all asylum grants during the decade.
More than 3.9 million asylum applications were awaiting processing as of September 2025. Of these, approximately 2.4 million were pending in immigration courts—comprising 62 percent of all cases in the immigration court system—and 1.5 million were with U.S. Citizenship and Immigration Services (USCIS). The average asylum case in immigration court takes about four years to be completed.
Adjustments to Lawful Permanent Resident Status
In FY 2023, close to 99,400 refugees and asylees adjusted their status to lawful permanent residence (LPR status, also known as getting a green card), of whom 59,000 (59 percent) were refugees and 40,300 (41 percent) were asylees (see Figure 5).
Figure 5. Refugees and Asylees Granted U.S. Lawful Permanent Residence, FY 2000-23

Source: DHS Office of Homeland Security Statistics, Yearbook of Immigration Statistics, various years, available online.
Refugees must apply for a green card one year after being admitted to the United States. Asylees become eligible to adjust to LPR status after one year of residence but are not required to do so. As green-card holders, refugees and asylees are eligible to receive federal student financial aid, join certain branches of the U.S. armed forces, and return from international travel without a U.S. entry visa. Having a green card is also a precondition for later applying for U.S. citizenship.
Temporary Humanitarian Programs
Beyond the refugee resettlement and asylum routes, which confer permanent residence to those deemed in need of protection, the federal government can provide temporary humanitarian protections through a variety of other programs. These include Temporary Protected Status (TPS), for individuals already present in the United States whose countries are experiencing conflict, political crisis, or natural disaster. There have been TPS designations for 28 countries and territories since 1990, when the authority was first created in law. The second Trump administration has sought to end TPS for nationals of 11 countries—Afghanistan, Cameroon, Ethiopia, Haiti, Honduras, Myanmar (also known as Burma), Nepal, Nicaragua, South Sudan, Syria, and Venezuela—affecting an estimated 1.1 million individuals. Court rulings have stayed the end of some of these programs.
The Trump administration also has taken aim at humanitarian protection programs used widely during the Biden administration, including one for Cubans, Haitians, Nicaraguans, and Venezuelans (CHNV), through which approximately 532,000 individuals entered the United States. Humanitarian parole had also previously been granted to approximately 76,000 Afghan evacuees following the August 2021 withdrawal of U.S. troops from Afghanistan and roughly 240,000 Ukrainians who arrived through the Uniting for Ukraine program. Additionally, in 2023 and 2024 approximately 936,500 people had used the CBP One app to schedule appointments at border posts to be considered for parole into the United States.
Sources
Ainsley, Julia. 2023. U.S. Has Admitted 271,000 Ukrainian Refugees since Russian Invasion, Far Above Biden’s Goal of 100,000. NBC News, February 24, 2023. Available online.
American Immigration Council. 2025. Temporary Protected Status (TPS): An Overview. American Immigration Council fact sheet, Washington, DC, November 2025. Available online.
Capps, Randy and Michael Fix. 2015. Ten Facts about U.S. Refugee Resettlement. Migration Policy Institute (MPI) fact sheet, Washington, DC, October 2015. Available online.
Chishti, Muzaffar and Jessica Bolter. 2019. The Travel Ban at Two: Rocky Implementation Settles into Deeper Impacts. Migration Information Source, January 31, 2019. Available online.
—. 2021. Border Challenges Dominate, but Biden’s First 100 Days Mark Notable Under-the-Radar Immigration Accomplishments. Migration Information Source, April 26, 2021. Available online.
Executive Office for Immigration Review (EOIR). 2025. Amnesty Cases by Presidential Term. Updated November 18, 2025. Available online.
—. 2025. Total Asylum Applications. Updated November 18, 2025. Available online.
Flahaux, Marie-Laurence and Bruno Schoumaker. 2016. Democratic Republic of the Congo: A Migration History Marked by Crises and Restrictions. Migration Information Source, April 20, 2016. Available online.
Migration Information Source. 2025. Top 10 Migration Issues of 2025. Migration Information Source, December 17, 2025. Available online.
Pierce, Sarah and Jessica Bolter. 2020. Dismantling and Reconstructing the U.S. Immigration System: A Catalog of Changes under the Trump Presidency. Washington, DC: MPI. Available online.
Regional Interagency Coordination Platform for Refugees and Migrants of Venezuela (R4V). 2025. Venezuelan Refugees and Migrants in the Region: November 2025. N.p.: R4V. Available online.
Schofield, Noah and Amanda Yap. 2024. Asylees: 2023. Washington, DC: U.S. Department of Homeland Security (DHS), Office of Homeland Security Statistics (OHSS). Available online.
United Nations High Commissioner for Refugees (UNHCR). 2025. Figures at a Glance. Updated November 4, 2025. Available online.
—. 2025. Mid-Year Trends: 2025. Geneva: UNHCR. Available online.
U.S. Citizenship and Immigration Service. 2025. Number of Service-Wide Forms by Quarter, Form Status, and Processing Time April 1, 2025 – June 30, 2025. Updated July 2025. Available online.
U.S. Customs and Border Protection (CBP). 2025. CBP Releases December 2024 Monthly Update. Press release, January 14, 2025. Available online.
U.S. Department of Homeland Security (DHS), Office of Homeland Security Statistics (OHSS). 2024. Yearbook of Immigration Statistics 2023. Washington, DC: DHS, OHSS. Available online.
U.S. State Department, Bureau of Population, Refugees, and Migration, Refugee Processing Center. 2025. Refugee Admissions Report. Updated November 30, 2025. Available online.
—. 2025. Refugee Arrivals by State and Nationality. Updated November 18, 2025. Available online.
Yap, Amanda. 2025. Refugees: 2024. Washington, DC: DHS, OHSS. Available online.

